Ramirez Corrects Republicans, Trump Mistake-Ridden Chart on Immigration
Ramirez fixed the immigration chart that Trump and Republicans claim saved the life of the former president during the July 13th assassination attempt
Washington, DC – Today, Congresswoman Delia C. Ramirez (IL-03), the Vice Ranking Member of the Homeland Security Committee, blasted Republicans for using their committee time to uplift a chart filled with mis- and disinformation on immigration. During a joint hearing of the Subcommittee on Border Security and Enforcement and the Subcommittee on Counterterrorism, Law Enforcement, and Intelligence, Congresswoman Ramirez pointed out six misrepresentations of the data.
Ramirez concluded her time by calling for Republicans to abandon the political rhetoric, stop spreading lies, and take seriously their work on the committee for the safety of their constituents and the nation.
VIDEO HERE
Remarks as prepared:
I want to start by acknowledging we are just a little more than one week from the anniversary of the heinous 9/11 terrorist attacks that took the lives of 2,977 people – 2,977 futures stolen.
Congress created this committee to ensure we protect the American people from terrorist attacks.
Unfortunately, my Republican colleagues are again choosing to use our committee time to spew false narratives, conspiracy theories, and racist tropes that paint all immigrants as terrorists – just to score cheap political points.
We should be using this committee to discuss how to strengthen the federal government’s ability to prevent and respond to terrorist threats by digging into data and evidence.
So, let me take a couple of minutes to do just that.
I want to ensure that the data this committee uses is accurately portrayed, and I talk about Donald Trump’s favorite chart.
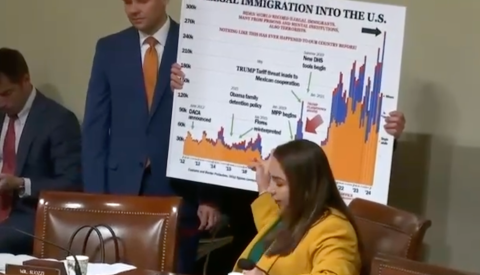
It’s this chart, titled “Illegal Immigration into the US: Biden World Record Illegal Immigrants, Many From Prisons and Mental Institutions, Also Terrorists.” Donald Trump has said this chart saved his life.
Yesterday, at our Full Committee hearing, Republicans repeatedly used this chart to allege that the Biden Administration has an open border policy. But this life-saving chart says … well… not what Republicans think it says.
First, I do not know where the Trumps and Republicans of the world who like to trot out this chart got the idea that immigration into the United States is a quote “world record” unquote. But recorded history is full of mass migration due to wars, famines, disease, and opportunity in numbers so high they wouldn’t even fit on this chart.
Second, and it’s almost embarrassing to have to explain this to Members of Congress and a former President, but when someone comes to the United States seeking asylum, that does not mean they literally came from … what does this chart say …oh, mental institutions.
Third, as my friend, Congressman Garcia pointed out yesterday, Republicans and former President Trump do not even know when Trump was in office. Their chart says he left in April of 2020.
Trump actually left office in January of 2021, when the numbers were on the rise and higher than at any point during Obama’s second term.
Fourth, the chart itself shows that when Trump came into office, the numbers began rising.
The dip in numbers where Trump claims he left office is actually in April 2020, at the height of the early COVID-19 pandemic when migration numbers dropped globally.
Trump was in office for another nine months, and the numbers steadily climbed.
And lastly, this month actually is not even the lowest during Trump’s time in office, or even in recorded history.
Facts matter, but I guess not when it comes to making charts for the former President.